まず、Hansen らのデータで損失と増加の両方が示されているピクセルを表示するバンドを作成するために必要な計算から始めましょう。
Hansen らのデータセットには、損失が発生したピクセルが 1 で、それ以外が 0 のバンド(loss)と、増加が発生したピクセルが 1 で、それ以外が 0 のバンド(gain)があります。loss バンドと gain バンドの両方のピクセルが 1 のバンドを作成するには、画像に対して and() 論理メソッドを使用します。and() メソッドは image1.and(image2) のように呼び出され、image1 と image2 の両方が 1 の場合はピクセルが 1、それ以外の場合は 0 の画像を返します。
コードエディタ(JavaScript)
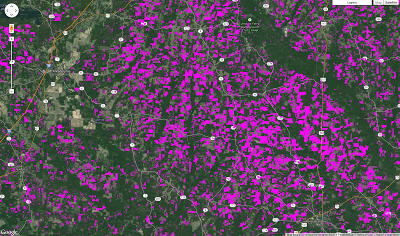
// Load the data and select the bands of interest.
var gfc2014 = ee.Image('UMD/hansen/global_forest_change_2015');
var lossImage = gfc2014.select(['loss']);
var gainImage = gfc2014.select(['gain']);

// Use the and() method to create the lossAndGain image.
var gainAndLoss = gainImage.and(lossImage);

// Show the loss and gain image.
Map.addLayer(gainAndLoss.updateMask(gainAndLoss),
    {palette: 'FF00FF'}, 'Gain and Loss');
アーカンソー州を拡大した衛星ビューの結果は、図 1 のようになります。
この例と前のセクションの結果を組み合わせると、チュートリアルの冒頭の図を再現できます。
コードエディタ(JavaScript)
// Displaying forest, loss, gain, and pixels where both loss and gain occur.
var gfc2014 = ee.Image('UMD/hansen/global_forest_change_2015');
var lossImage = gfc2014.select(['loss']);
var gainImage = gfc2014.select(['gain']);
var treeCover = gfc2014.select(['treecover2000']);

// Use the and() method to create the lossAndGain image.
var gainAndLoss = gainImage.and(lossImage);

// Add the tree cover layer in green.
Map.addLayer(treeCover.updateMask(treeCover),
    {palette: ['000000', '00FF00'], max: 100}, 'Forest Cover');

// Add the loss layer in red.
Map.addLayer(lossImage.updateMask(lossImage),
    {palette: ['FF0000']}, 'Loss');

// Add the gain layer in blue.
Map.addLayer(gainImage.updateMask(gainImage),
    {palette: ['0000FF']}, 'Gain');

// Show the loss and gain image.
Map.addLayer(gainAndLoss.updateMask(gainAndLoss),
    {palette: 'FF00FF'}, 'Gain and Loss');
対象地域の森林の変化を定量化する
Hansen らのデータセットのバンドについて理解を深めたので、これまでに学習したコンセプトを使用して、対象地域の森林の増加と減少に関する統計情報を計算できます。そのためには、ベクターデータ(ポイント、ライン、ポリゴン)を使用する必要があります。ベクター データセットは、Earth Engine では FeatureCollection として表されます。(フィーチャー コレクションとベクトルデータのインポート方法の詳細をご覧ください)。
このセクションでは、2012 年にコンゴ共和国内で発生した森林消失の総量と、同時に国内の保護区内で発生した森林消失の量を比較します。
Earth Engine API のチュートリアルで説明したように、画像リージョン内の統計情報を計算する主なメソッドは reduceRegion() です。(画像領域の縮小の詳細をご覧ください)。たとえば、調査期間中の森林減少を表す推定ピクセル数を計算するとします。この目的のために、次のコードを検討します。
コードエディタ(JavaScript)
// Load country features from Large Scale International Boundary (LSIB) dataset.
var countries = ee.FeatureCollection('USDOS/LSIB_SIMPLE/2017');

// Subset the Congo Republic feature from countries.
var congo = countries.filter(ee.Filter.eq('country_na', 'Rep of the Congo'));

// Get the forest loss image.
var gfc2014 = ee.Image('UMD/hansen/global_forest_change_2015');
var lossImage = gfc2014.select(['loss']);

// Sum the values of forest loss pixels in the Congo Republic.
var stats = lossImage.reduceRegion({
  reducer: ee.Reducer.sum(),
  geometry: congo,
  scale: 30
});
print(stats);
この例では、ee.Reducer.sum() リデューサーを使用して、congo フィーチャー内の lossImage のピクセルの値を合計します。lossImage は値が 1 または 0 のピクセル(それぞれ損失ありまたは損失なし)で構成されているため、これらの値の合計は、リージョン内の損失のピクセル数に相当します。
残念ながら、このスクリプトをそのまま実行すると、次のようなエラーが発生します。
reduceRegion() のデフォルトの最大ピクセル数は 1,000 万です。このエラー メッセージは、コンゴ共和国が約 3 億 8,300 万個の Landsat ピクセルをカバーしていることを示しています。幸いなことに、reduceRegion() には多くのパラメータがあり、そのうちの 1 つ(maxPixels)を使用すると、計算で使用されるピクセル数を制御できます。このパラメータを指定すると、計算が成功します。
コードエディタ(JavaScript)
// Load country features from Large Scale International Boundary (LSIB) dataset.
var countries = ee.FeatureCollection('USDOS/LSIB_SIMPLE/2017');

// Subset the Congo Republic feature from countries.
var congo = countries.filter(ee.Filter.eq('country_na', 'Rep of the Congo'));

// Get the forest loss image.
var gfc2014 = ee.Image('UMD/hansen/global_forest_change_2015');
var lossImage = gfc2014.select(['loss']);

// Sum the values of forest loss pixels in the Congo Republic.
var stats = lossImage.reduceRegion({
  reducer: ee.Reducer.sum(),
  geometry: congo,
  scale: 30,
  maxPixels: 1e9
});
print(stats);
コンソールに出力されたオブジェクトを展開すると、結果が 4,897,933 ピクセルの森林損失であることがわかります。コンソールでの出力を少し整理するには、出力をラベル付けし、reduceRegion() から返されたディクショナリから目的の結果を取得します。
コードエディタ(JavaScript)
print('pixels representing loss: ', stats.get('loss'));
ピクセル領域の計算
コンゴ共和国でどれだけの面積が失われ、そのうちどれだけの面積が保護区で失われたのかという質問に答える準備がほぼ整いました。残りの部分は、ピクセルを実際の面積に変換することです。この変換は、reduceRegion() に入力されるピクセルのサイズが必ずしもわかっているとは限らないため、重要です。面積の計算を支援するため、Earth Engine には ee.Image.pixelArea() メソッドがあります。このメソッドは、各ピクセルの値がピクセルの面積(平方メートル)である画像を生成します。損失画像にこの面積画像を掛けて結果を合計すると、面積の測定値が得られます。
コードエディタ(JavaScript)
// Load country features from Large Scale International Boundary (LSIB) dataset.
var countries = ee.FeatureCollection('USDOS/LSIB_SIMPLE/2017');

// Subset the Congo Republic feature from countries.
var congo = countries.filter(ee.Filter.eq('country_na', 'Rep of the Congo'));

// Get the forest loss image.
var gfc2014 = ee.Image('UMD/hansen/global_forest_change_2015');
var lossImage = gfc2014.select(['loss']);
var areaImage = lossImage.multiply(ee.Image.pixelArea());

// Sum the values of forest loss pixels in the Congo Republic.
var stats = areaImage.reduceRegion({
  reducer: ee.Reducer.sum(),
  geometry: congo,
  scale: 30,
  maxPixels: 1e9
});
print('pixels representing loss: ', stats.get('loss'), 'square meters');
調査期間中に失われた面積は 4,372,575,052 平方メートルです。
これで、このセクションの冒頭の質問に答える準備が整いました。2012 年にコンゴ共和国で失われた森林面積はどのくらいで、そのうち保護区の面積はどのくらいですか?
コードエディタ(JavaScript)
// Load country features from Large Scale International Boundary (LSIB) dataset.
var countries = ee.FeatureCollection('USDOS/LSIB_SIMPLE/2017');

// Subset the Congo Republic feature from countries.
var congo = ee.Feature(
  countries
    .filter(ee.Filter.eq('country_na', 'Rep of the Congo'))
    .first()
);

// Subset protected areas to the bounds of the congo feature
// and other criteria. Clip to the intersection with congo.
var protectedAreas = ee.FeatureCollection('WCMC/WDPA/current/polygons')
  .filter(ee.Filter.and(
    ee.Filter.bounds(congo.geometry()),
    ee.Filter.neq('IUCN_CAT', 'VI'),
    ee.Filter.neq('STATUS', 'proposed'),
    ee.Filter.lt('STATUS_YR', 2010)
  ))
  .map(function(feat){
    return congo.intersection(feat);
  });

// Get the loss image.
var gfc2014 = ee.Image('UMD/hansen/global_forest_change_2015');
var lossIn2012 = gfc2014.select(['lossyear']).eq(12);
var areaImage = lossIn2012.multiply(ee.Image.pixelArea());

// Calculate the area of loss pixels in the Congo Republic.
var stats = areaImage.reduceRegion({
  reducer: ee.Reducer.sum(),
  geometry: congo.geometry(),
  scale: 30,
  maxPixels: 1e9
});
print(
  'Area lost in the Congo Republic:',
  stats.get('lossyear'),
  'square meters'
);

// Calculate the area of loss pixels in the protected areas.
var stats = areaImage.reduceRegion({
  reducer: ee.Reducer.sum(),
  geometry: protectedAreas.geometry(),
  scale: 30,
  maxPixels: 1e9
});
print(
  'Area lost in protected areas:',
  stats.get('lossyear'),
  'square meters'
);
この出力は、2012 年にコンゴ共和国で失われた森林面積 348,036,295 平方メートルのうち、世界保護地域データベースの表に示されているように、11,880,976 平方メートルが保護地域であったことを示しています。
このスクリプトと直前のスクリプトの違いは、保護地域の情報を追加したことと、スクリプトが全体的な損失を調べるのではなく、2012 年の損失を調べるように変更したことだけです。これには 2 つの変更が必要でした。まず、2012 年に損失が記録された場所では 1、それ以外では 0 を示す新しい lossIn2012 画像があります。2 つ目は、バンドの名前が異なる(loss ではなく lossyear)ため、print ステートメントでプロパティ名を変更する必要があったことです。
次のセクションでは、このセクションで行ったように 1 年間だけでなく、毎年森林消失を計算してグラフ化する高度な方法について説明します。