Lớp dữ liệu Cường độ thay đổi của sự xuất hiện nước cung cấp thông tin đo lường về mức độ thay đổi của nước trên bề mặt giữa 2 giai đoạn: 1984 – 1999 và 2000 – 2015. Lớp này tính trung bình mức thay đổi trên các cặp tháng tương đồng lấy từ hai giai đoạn. Hãy xem Hướng dẫn sử dụng dữ liệu (phiên bản 2) để biết thêm thông tin chi tiết về lớp này.
Phần này của hướng dẫn sẽ:
- thêm một lớp bản đồ có kiểu để trực quan hoá cường độ thay đổi của sự xuất hiện nước, và
- tóm tắt cường độ thay đổi trong một vùng quan tâm cụ thể bằng biểu đồ.
Hình ảnh trực quan
Tương tự như lớp xuất hiện của nước, chúng ta sẽ bắt đầu bằng cách thêm một hình ảnh trực quan cơ bản về cường độ thay đổi xuất hiện vào bản đồ, sau đó cải thiện hình ảnh đó. Cường độ thay đổi tần suất xuất hiện được cung cấp theo 2 cách, cả dưới dạng giá trị tuyệt đối và giá trị được chuẩn hoá. Chúng ta sẽ sử dụng các giá trị tuyệt đối trong hướng dẫn này. Bắt đầu bằng cách chọn lớp cường độ thay đổi tuyệt đối về số lần xuất hiện trong hình ảnh GSW:
Trình soạn thảo mã (JavaScript)
var change = gsw.select("change_abs");
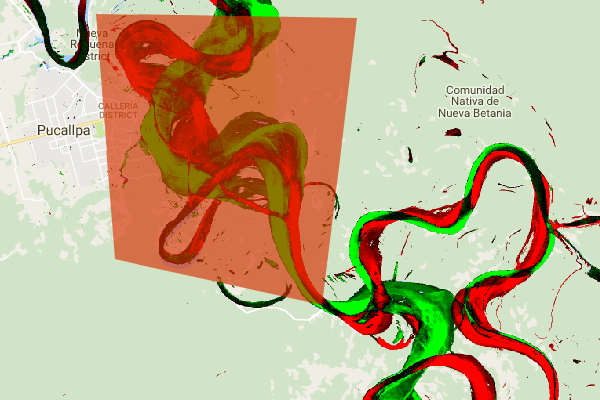
Trong phần Hằng số của mã, hãy thêm một câu lệnh tạo một biến mới xác định cách tạo kiểu cho lớp. Kiểu này cho thấy những khu vực có sự xuất hiện của nước mặt giảm/tăng bằng màu đỏ/xanh lục. Những khu vực có nước trên bề mặt tương đối không thay đổi sẽ có màu đen.
Trình soạn thảo mã (JavaScript)
var VIS_CHANGE = {
    min:-50,
    max:50,
    palette: ['red', 'black', 'limegreen']
};
Ở cuối phần Lớp bản đồ của mã, hãy thêm một câu lệnh để thêm một lớp mới vào bản đồ.
Trình soạn thảo mã (JavaScript)
Map.setCenter(-74.4557, -8.4289, 11);  // Ucayali River, Peru
Map.addLayer({
  eeObject: change,
  visParams: VIS_CHANGE,
  name: 'occurrence change intensity'
});

Tóm tắt thay đổi trong một khu vực quan tâm
Trong phần này, chúng ta sẽ tóm tắt mức độ thay đổi trong một khu vực quan tâm cụ thể. Để chỉ định một khu vực quan tâm, hãy nhấp vào công cụ vẽ đa giác. Đây là một trong những Công cụ hình học. Thao tác này sẽ tạo một lớp Nhập hình học mới, theo mặc định có tên là "geometry" (hình học). Để thay đổi tên, hãy nhấp vào biểu tượng bánh răng ở bên phải tên lớp. (Xin lưu ý rằng bạn có thể cần đặt con trỏ lên tên lớp để tên lớp xuất hiện.)
Đổi tên lớp thành roi (đối với vùng quan tâm hoặc ROI). Sau đó, chúng ta có thể nhấp vào một loạt điểm trên bản đồ để xác định một vùng đa giác mà chúng ta quan tâm.
Giờ đây, khi đã xác định và lưu trữ khu vực quan tâm trong một biến, chúng ta có thể dùng biến đó để tính toán biểu đồ tần suất của cường độ thay đổi cho ROI. Thêm mã sau vào phần Calculations (Tính toán) của tập lệnh.
Trình soạn thảo mã (JavaScript)
// Calculate a change intensity for the region of interest.
var histogram = change.reduceRegion({
  reducer: ee.Reducer.histogram(),
  geometry: roi,
  scale: 30,
  bestEffort: true,
});
print(histogram);
Câu lệnh đầu tiên tính toán biểu đồ tần suất của các giá trị cường độ thay đổi xuất hiện trong ROI, lấy mẫu ở tỷ lệ 30m. Lệnh thứ hai in đối tượng kết quả vào Thẻ bảng điều khiển của Trình chỉnh sửa mã. Bạn có thể mở rộng cây đối tượng để xem các giá trị của các nhóm biểu đồ. Dữ liệu dạng số vẫn có, nhưng có những cách trực quan hoá kết quả hiệu quả hơn.

Để cải thiện điều này, chúng ta có thể tạo biểu đồ phân bố thay thế. Thay thế câu lệnh xác định đối tượng biểu đồ bằng các câu lệnh sau:
Trình soạn thảo mã (JavaScript)
// Generate a histogram object and print it to the console tab.
var histogram = ui.Chart.image.histogram({
  image: change,
  region: roi,
  scale: 30,
  minBucketWidth: 10
});
histogram.setOptions({
  title: 'Histogram of surface water change intensity.'
});
Các câu lệnh này tạo một đối tượng biểu đồ, thay thế cây đối tượng biểu đồ trong Thẻ điều khiển bằng một biểu đồ. Phương thức biểu đồ chứa một số đối số, bao gồm scale (xác định tỷ lệ không gian, tính bằng mét, mà tại đó vùng quan tâm được lấy mẫu) và minBucketWidth (được dùng để kiểm soát chiều rộng của các nhóm biểu đồ tần suất).
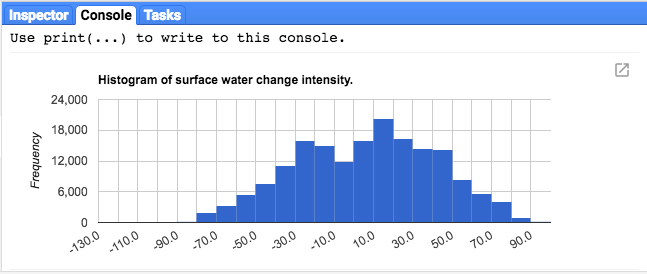
Bạn có thể khám phá các giá trị trên biểu đồ một cách tương tác bằng cách đặt con trỏ lên các thanh biểu đồ tần suất.
Tập lệnh cuối cùng
Toàn bộ tập lệnh cho phần này được liệt kê bên dưới. Xin lưu ý rằng tập lệnh này bao gồm các câu lệnh để xác định một hình học đa giác (roi), có thể so sánh với hình học mà bạn đã tạo bằng các công cụ hình học của Trình chỉnh sửa mã.
Trình soạn thảo mã (JavaScript)
//////////////////////////////////////////////////////////////
// Asset List
//////////////////////////////////////////////////////////////

var gsw = ee.Image('JRC/GSW1_0/GlobalSurfaceWater');
var occurrence = gsw.select('occurrence');
var change = gsw.select("change_abs");
var roi = /* color: 0B4A8B */ee.Geometry.Polygon(
        [[[-74.17213, -8.65569],
          [-74.17419, -8.39222],
          [-74.38362, -8.36980],
          [-74.43031, -8.61293]]]);

//////////////////////////////////////////////////////////////
// Constants
//////////////////////////////////////////////////////////////

var VIS_OCCURRENCE = {
    min:0,
    max:100,
    palette: ['red', 'blue']
};
var VIS_CHANGE = {
    min:-50,
    max:50,
    palette: ['red', 'black', 'limegreen']
};
var VIS_WATER_MASK = {
  palette: ['white', 'black']
};

//////////////////////////////////////////////////////////////
// Calculations
//////////////////////////////////////////////////////////////

// Create a water mask layer, and set the image mask so that non-water areas are transparent.
var water_mask = occurrence.gt(90).mask(1);

// Generate a histogram object and print it to the console tab.
var histogram = ui.Chart.image.histogram({
  image: change,
  region: roi,
  scale: 30,
  minBucketWidth: 10
});
histogram.setOptions({
  title: 'Histogram of surface water change intensity.'
});
print(histogram);

//////////////////////////////////////////////////////////////
// Initialize Map Location
//////////////////////////////////////////////////////////////

// Uncomment one of the following statements to center the map on
// a particular location.
// Map.setCenter(-90.162, 29.8597, 10);   // New Orleans, USA
// Map.setCenter(-114.9774, 31.9254, 10); // Mouth of the Colorado River, Mexico
// Map.setCenter(-111.1871, 37.0963, 11); // Lake Powell, USA
// Map.setCenter(149.412, -35.0789, 11);  // Lake George, Australia
// Map.setCenter(105.26, 11.2134, 9);     // Mekong River Basin, SouthEast Asia
// Map.setCenter(90.6743, 22.7382, 10);   // Meghna River, Bangladesh
// Map.setCenter(81.2714, 16.5079, 11);   // Godavari River Basin Irrigation Project, India
// Map.setCenter(14.7035, 52.0985, 12);   // River Oder, Germany & Poland
// Map.setCenter(-59.1696, -33.8111, 9);  // Buenos Aires, Argentina\
Map.setCenter(-74.4557, -8.4289, 11);  // Ucayali River, Peru

//////////////////////////////////////////////////////////////
// Map Layers
//////////////////////////////////////////////////////////////

Map.addLayer({
  eeObject: water_mask,
  visParams: VIS_WATER_MASK,
  name: '90% occurrence water mask',
  shown: false
});
Map.addLayer({
  eeObject: occurrence.updateMask(occurrence.divide(100)),
  name: "Water Occurrence (1984-2015)",
  visParams: VIS_OCCURRENCE,
  shown: false
});
Map.addLayer({
  eeObject: change,
  visParams: VIS_CHANGE,
  name: 'occurrence change intensity'
});
Trong phần tiếp theo, bạn sẽ khám phá thêm cách nước thay đổi theo thời gian bằng cách làm việc với lớp chuyển đổi lớp nước.