NDVI، نگاشت یک تابع بر روی یک مجموعه، موزاییک کیفیت
با مجموعهها، منظم بمانید
ذخیره و طبقهبندی محتوا براساس اولویتهای شما.
قبلاً، یاد گرفتید که چگونه با انجام کاری شبیه به این، صحنههای جداگانه Landsat را بدست آورید، جایی که l8 و point وارداتی هستند که مجموعه Landsat 8 TOA و یک هندسه منطقه مورد علاقه را نشان میدهند:
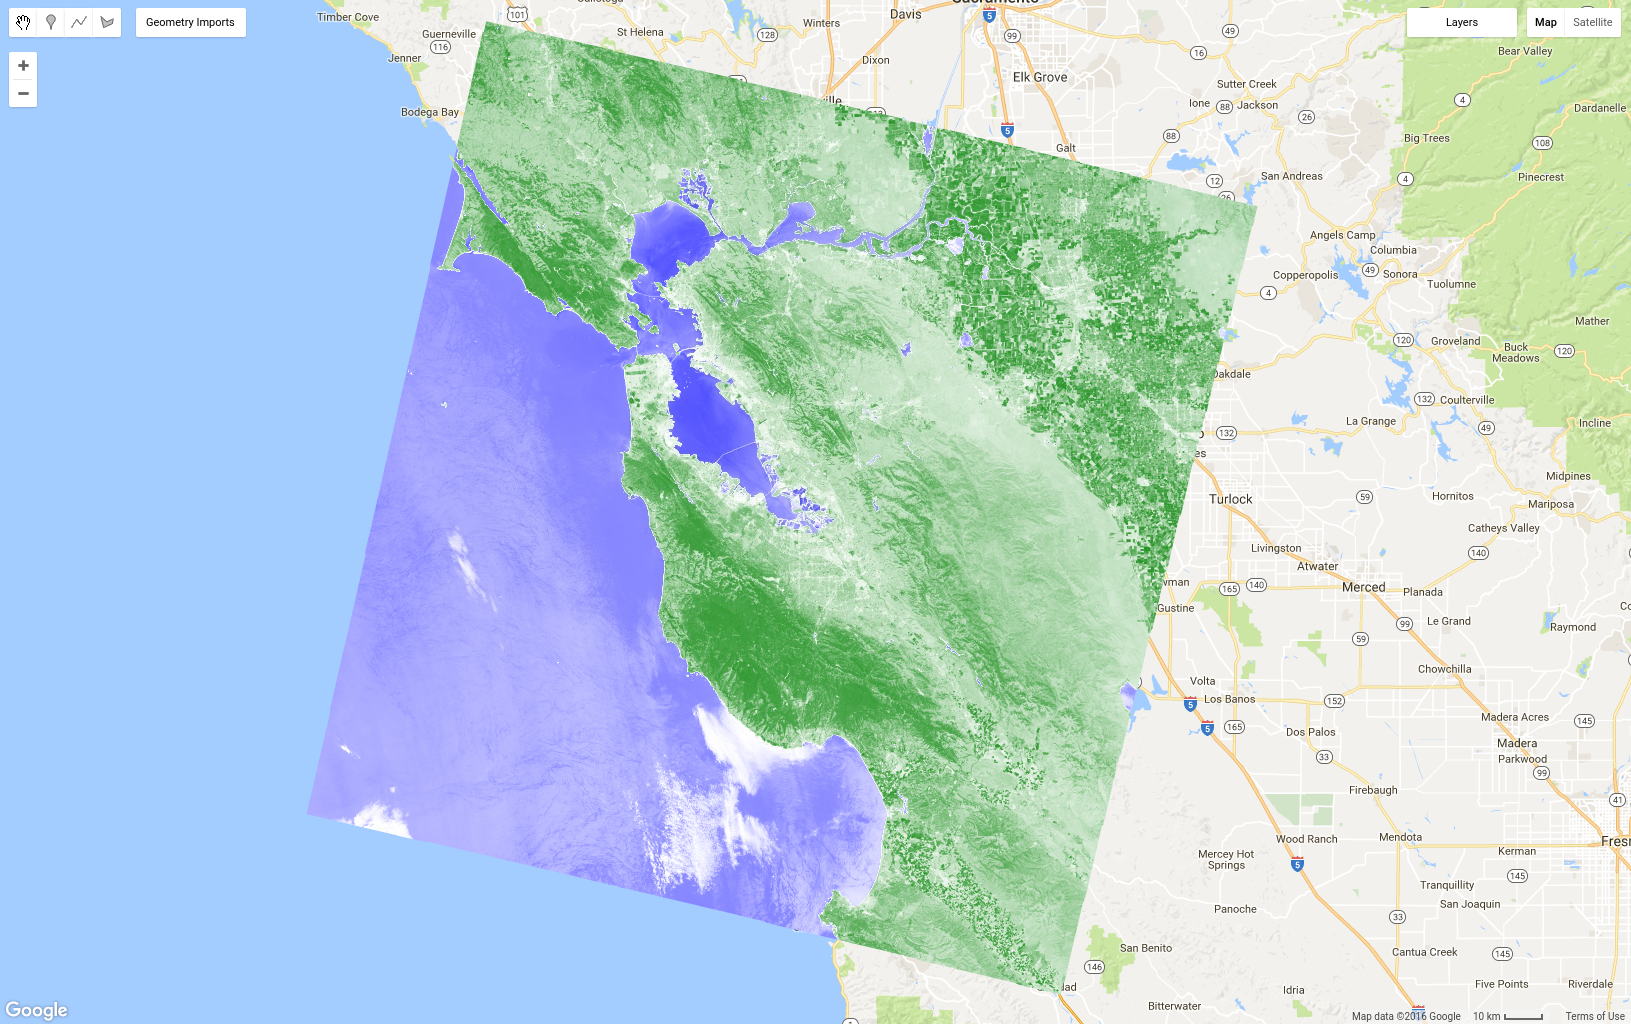
اکنون فرض کنید که می خواهید یک تصویر شاخص گیاهی تفاوت نرمال شده (NDVI) را از تصویر Landsat محاسبه کنید. پوشش گیاهی نور را در قسمت مادون قرمز نزدیک (NIR) از طیف الکترومغناطیسی منعکس می کند و نور را در قسمت قرمز جذب می کند ( در مورد بازتاب NIR از پوشش گیاهی بیشتر بدانید ). NDVI از این برای ایجاد یک مقدار واحد استفاده می کند که تقریباً منعکس کننده فعالیت فتوسنتزی در یک پیکسل است. محاسبه (NIR - قرمز) / (NIR + قرمز) است. این منجر به عددی بین 1 و -1 می شود که در آن پیکسل هایی با فعالیت فتوسنتزی بالا دارای NDVI بالایی هستند. این یکی از راههای محاسبه NDVI در Earth Engine است:
نتیجه باید چیزی شبیه به شکل 8 باشد. توجه داشته باشید که ما از تابع select() که در بخش قبلی در مورد ماسک کردن یاد گرفتید استفاده می کنیم تا NIR و باندهای قرمز را بدست آوریم، سپس NDVI را با استفاده از عملگرهای ریاضی تصویر که قبلاً در بخش Image math دیده اید محاسبه می کنیم. در نهایت تصویر را با یک پالت نمایش دهید. در اینجا ما از نام رنگ ها به جای رشته های هگزا در پالت استفاده کردیم. (برای جزئیات به این مرجع خارجی در مورد رنگ CSS مراجعه کنید.)
شکل 8. NDVI برای یک صحنه منفرد Landsat. آبی کم و سبز NDVI زیاد است.
عملیات تفاوت نرمال شده در سنجش از دور بسیار فراگیر است، یک تابع میانبر روی ee.Image وجود دارد که برای ساده کردن کد در مثال قبلی مفید است:
اکنون فرض کنید که می خواهید NDVI را به هر تصویر در مجموعه تصاویر اضافه کنید. روش انجام این کار در Earth Engine این است که یک تابع را روی مجموعه map() . map() را با شی Map اشتباه نگیرید. اولی یک روش در یک مجموعه است و از نقشه به معنای محاسباتی موازی برای اعمال یک تابع برای هر عنصر در یک مجموعه استفاده می کند. تابع، عملیاتی را که برای هر عنصر در مجموعه اعمال می شود، تعریف می کند. شما یک تابع ساده را در آموزش جاوا اسکریپت مشاهده کرده اید، اما اکنون می خواهیم تابعی بسازیم که شامل عملکرد Earth Engine است. به عنوان مثال، کد NDVI قبلی را در تابعی کپی کنید که تصویر ورودی را با یک باند NDVI برمی گرداند:
این کد ممکن است برای محاسبه NDVI برای یک تصویر منفرد کارآمد نباشد، اما این تابع می تواند به عنوان آرگومان برای map() استفاده شود تا یک باند NDVI به هر تصویر در مجموعه اضافه شود. اغلب مفید است که ابتدا یک تابع را روی یک تصویر آزمایش کنید تا مطمئن شوید که عملکرد همانطور که انتظار دارید عمل می کند. هنگامی که عملکرد را بر روی یک تصویر جداگانه آزمایش کردید و مشخص کردید که آنچه را که می خواهید انجام می دهد، می توانید آن را روی مجموعه نگاشت کنید:
برای تأیید اینکه واقعاً یک باند NDVI را در هر تصویر در این مجموعه قرار می دهد، می توانید مجموعه withNDVI را به نقشه اضافه کنید و یک مکان تصادفی را با زبانه Inspector جستجو کنید. باید توجه داشته باشید که هر تصویر در مجموعه اکنون دارای یک باند به نام NDVI است.
سبزترین ترکیب پیکسلی را بسازید
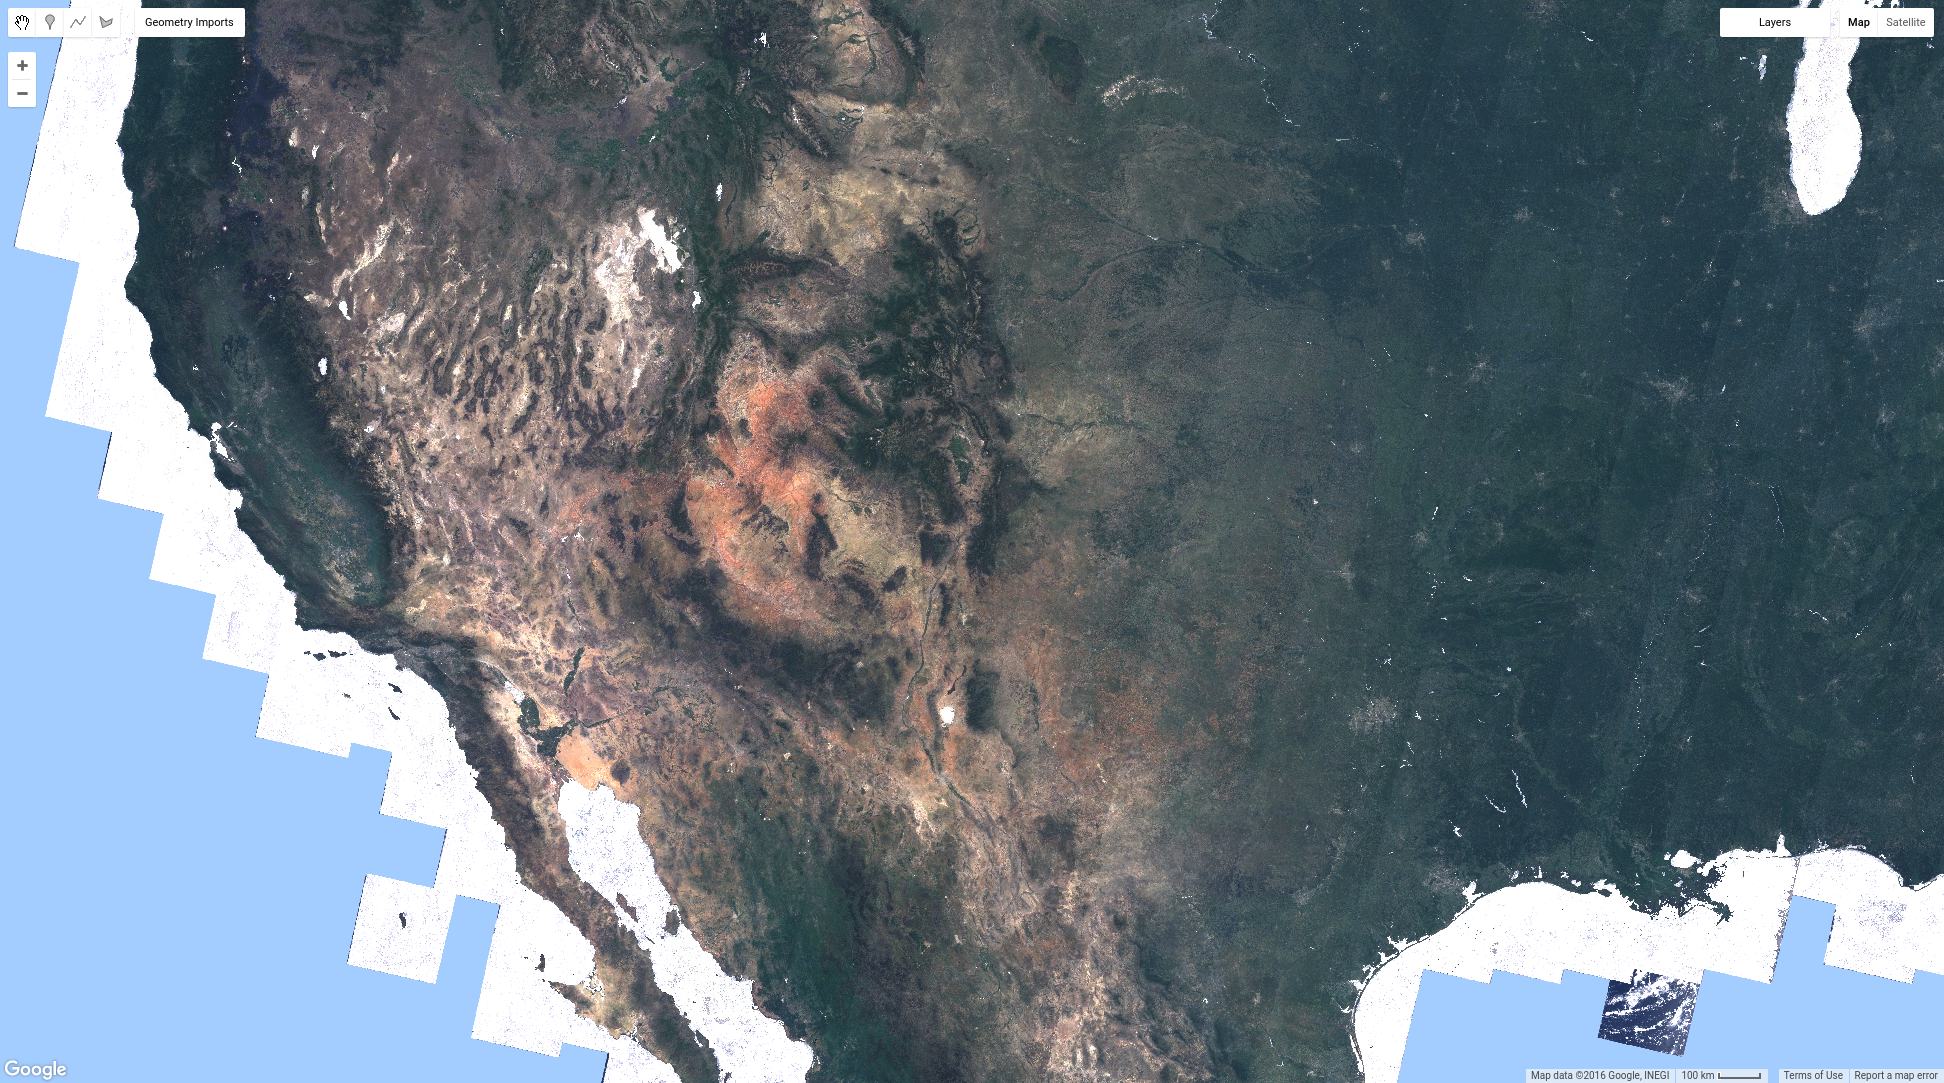
اکنون که مجموعهای از تصاویر ساختهاید که در آن هر تصویر دارای یک باند NDVI است، میتوانیم راه جدیدی برای ساخت کامپوزیتها کشف کنیم: qualityMosaic() . ممکن است متوجه ناپیوستگی مسیرهای Landsat شده باشید، حتی در کامپوزیت پیکسل میانه. بخشی از دلیل آن ممکن است به دلیل تفاوت در فنولوژی در نتیجه جمع آوری تصاویر در مسیرهای مجاور در زمان های مختلف (مخصوصاً با فاصله 8 روز) باشد. یک راه برای به حداقل رساندن این امر این است که سعی کنید مقادیر پیکسل را در کامپوزیت تقریباً از همان مرحله فنولوژیکی تنظیم کنید، برای مثال زمان حداکثر سبز شدن گیاهان (زمانی که برگها روشن هستند و از نظر فتوسنتزی فعال هستند). اگر اجازه دهیم حداکثر سبزی با حداکثر NDVI تعریف شود، میتوانیم از qualityMosaic() برای ایجاد ترکیبی استفاده کنیم که در آن هر پیکسل حداکثر پیکسل NDVI از مجموعه را داشته باشد. اکنون می توانید از باند NDVI اضافه شده در مجموعه withNDVI خود استفاده کنید:
نتیجه این کد باید چیزی شبیه به شکل 9 باشد. با مقایسه شکل 9 با کامپوزیت میانه نشان داده شده در شکل 6 ، مشاهده کنید که سبزترین کامپوزیت پیکسل در واقع بسیار سبزتر است. با این حال، بررسی دقیق بدنه های آبی باید مشکل دیگری را آشکار کند. به طور خاص، بدنه های آبی اکنون کدر به نظر می رسند. این به دلیل نحوه عملکرد متد qualityMosaic() است: در هر مکان، کل سری زمانی بررسی میشود و پیکسل با حداکثر مقدار در باند NDVI به عنوان مقدار ترکیبی تنظیم میشود. از آنجایی که NDVI روی ابرها بالاتر از آب است، مناطق آبی دارای پیکسل های ابری می شوند، در حالی که مناطق پوشش گیاهی همه سبز به نظر می رسند زیرا NDVI زمانی که پوشش گیاهی در پیکسل از نظر فتوسنتزی فعال است، بالاترین سطح را دارد.
شکل 9. لندست 8 سبزترین کامپوزیت پیکسل.
اکنون چندین روش برای ترکیب و موزاییک تصاویر در Earth Engine دیده اید. میتوانید ترکیبهایی با ارزش اخیر، متوسط یا سبزترین پیکسل از تصاویر فیلتر شده بر اساس زمان و مکان یا همه تصاویر موجود در مجموعه ایجاد کنید. شما یاد گرفته اید که چگونه محاسبات را روی تصاویر انجام دهید و اطلاعات را استخراج کنید. صفحه بعدی راه هایی برای دریافت اطلاعات از Earth Engine، به عنوان مثال به عنوان نمودار یا مجموعه داده صادر شده به پوشه Google Drive شما را پوشش می دهد.
تاریخ آخرین بهروزرسانی 2025-07-24 بهوقت ساعت هماهنگ جهانی.
[null,null,["تاریخ آخرین بهروزرسانی 2025-07-24 بهوقت ساعت هماهنگ جهانی."],[[["\u003cp\u003eThis guide explains how to calculate and add an NDVI (Normalized Difference Vegetation Index) band to Landsat 8 imagery in Earth Engine.\u003c/p\u003e\n"],["\u003cp\u003eIt demonstrates how to use the \u003ccode\u003emap()\u003c/code\u003e function to apply a custom function, like NDVI calculation, to every image in a collection.\u003c/p\u003e\n"],["\u003cp\u003eThe tutorial explores creating a "greenest-pixel" composite using \u003ccode\u003equalityMosaic()\u003c/code\u003e to highlight areas with peak vegetation.\u003c/p\u003e\n"],["\u003cp\u003eIt highlights the potential issues with using \u003ccode\u003equalityMosaic()\u003c/code\u003e for compositing, such as cloud contamination in water bodies due to NDVI values.\u003c/p\u003e\n"],["\u003cp\u003eUsers are encouraged to further explore data extraction and visualization techniques in subsequent tutorials.\u003c/p\u003e\n"]]],[],null,["# NDVI, Mapping a Function over a Collection, Quality Mosaicking\n\nPreviously, you learned how to get individual Landsat scenes by doing something like this,\nwhere `l8` and `point` are imports representing the Landsat 8 TOA\ncollection and an area-of-interest geometry:\n\n\n### Code Editor (JavaScript)\n\n```javascript\n// Define a point of interest. Use the UI Drawing Tools to import a point\n// geometry and name it \"point\" or set the point coordinates with the\n// ee.Geometry.Point() function as demonstrated here.\nvar point = ee.Geometry.Point([-122.292, 37.9018]);\n\n// Import the Landsat 8 TOA image collection.\nvar l8 = ee.ImageCollection('LANDSAT/LC08/C02/T1_TOA');\n\n// Get the least cloudy image in 2015.\nvar image = ee.Image(\n l8.filterBounds(point)\n .filterDate('2015-01-01', '2015-12-31')\n .sort('CLOUD_COVER')\n .first()\n);\n```\n\nSuppose now that you want to compute a Normalized Difference Vegetation Index (NDVI)\nimage from the Landsat image. Vegetation reflects light in the\nnear-infrared (NIR) part of the electromagnetic spectrum and absorbs light in the red\npart ([Learn more about NIR\nreflectance from vegetation](https://science.nasa.gov/ems/08_nearinfraredwaves)). NDVI uses this to create a single value roughly\nreflecting the photosynthetic activity occurring at a pixel. The calculation is\n(NIR - red) / (NIR + red). This results in a number between 1 and -1, where pixels with\nhigh photosynthetic activity have a high NDVI. This is one way to compute NDVI in Earth\nEngine:\n\n### Code Editor (JavaScript)\n\n```javascript\n// Compute the Normalized Difference Vegetation Index (NDVI).\nvar nir = image.select('B5');\nvar red = image.select('B4');\nvar ndvi = nir.subtract(red).divide(nir.add(red)).rename('NDVI');\n\n// Display the result.\nMap.centerObject(image, 9);\nvar ndviParams = {min: -1, max: 1, palette: ['blue', 'white', 'green']};\nMap.addLayer(ndvi, ndviParams, 'NDVI image');\n```\n\nThe result should look something like Figure 8. Note that we use the `select()`\nfunction you learned about in the [previous section on\nmasking](/earth-engine/tutorials/tutorial_api_05#masking) to get the NIR and red bands, then compute NDVI using image mathematical\noperators that that you have also [seen before in\nthe section on `Image` math](/earth-engine/tutorials/tutorial_api_03#image-math). Finally, display the image with a palette. Here\nwe used color names instead of hex strings in the palette. (See\n[this external\nreference about CSS color](https://developer.mozilla.org/en-US/docs/Web/CSS/color_value) for details.)\nFigure 8. NDVI for a single Landsat scene. Blue is low and green is high NDVI.\n\nThe normalized difference operation is so ubiquitous in remote sensing, there is a\n[shortcut function](/earth-engine/apidocs/ee-image-normalizeddifference) on an\n`ee.Image` that is useful for simplifying the code in the previous example:\n\n### Code Editor (JavaScript)\n\n```javascript\nvar ndvi = image.normalizedDifference(['B5', 'B4']).rename('NDVI');\n```\n\nMapping a Function over a Collection\n------------------------------------\n\nSuppose now that you want to add NDVI to *every* image in an image collection. The\nway to do that in Earth Engine is to `map()` a function over the collection.\nDon't confuse `map()` with the `Map` object. The former is a method\non a collection, and uses *map* in the\n[parallel computing sense](https://en.wikipedia.org/wiki/Map_(parallel_pattern))\nof applying a function to every element in a collection. The function defines the\noperations that will be applied to every element in the collection. You have seen\n[a simple function in the JavaScript tutorial](/earth-engine/tutorials/tutorial_js_01#functions), but\nnow we're going to make a function that includes Earth Engine functionality. For example,\ncopy the previous NDVI code into a function which returns the input image with an NDVI band:\n\n### Code Editor (JavaScript)\n\n```javascript\nvar addNDVI = function(image) {\n var ndvi = image.normalizedDifference(['B5', 'B4']).rename('NDVI');\n return image.addBands(ndvi);\n};\n\n// Test the addNDVI function on a single image.\nvar ndvi = addNDVI(image).select('NDVI');\n```\n\nThis code might not be as efficient for computing NDVI for a single image, but this\nfunction can be used as an argument to `map()` in order to add an NDVI band\nto every image in the collection. It's often useful to first test a function on a single\nimage, to make sure the function is behaving as you expect. Once you've tested the function\non an individual image and have determined that it does what you want, you can map it\nover the collection:\n\n### Code Editor (JavaScript)\n\n```javascript\nvar withNDVI = l8.map(addNDVI);\n```\n\nTo verify that this is indeed putting an NDVI band in every image in this collection,\nyou can add the `withNDVI` collection to the map and query a random location\nwith the **Inspector** tab. You should notice that each image in the\ncollection now has a band called `NDVI`.\n\nMake a greenest pixel composite\n-------------------------------\n\nNow that you've made an image collection in which each image has an NDVI band, we can\nexplore a new way to make composites: `qualityMosaic()`. You may have noticed\ndiscontinuities between Landsat paths, even in the median pixel composite. Part of the\nreason for that may be due to differences in\n[phenology](https://en.wikipedia.org/wiki/Phenology) as a result of images in\nadjacent paths being collected at different times (specifically, 8 days apart). One way to\nminimize this is to try to set pixel values in the composite from roughly the same\nphenological stage, for example the time of maximum greenness of plants (when the leaves\nare on and photosynthetically active). If we let max greenness be defined by the maximum\nNDVI, we can use\n[`qualityMosaic()`](/earth-engine/apidocs/ee-imagecollection-qualitymosaic) to\nmake a composite in which each pixel contains the maximum NDVI pixel from the collection.\nNow you can make use of the added NDVI band in your `withNDVI` collection:\n\n### Code Editor (JavaScript)\n\n```javascript\n// Make a \"greenest\" pixel composite.\nvar greenest = withNDVI.qualityMosaic('NDVI');\n\n// Display the result.\nvar visParams = {bands: ['B4', 'B3', 'B2'], max: 0.3};\nMap.addLayer(greenest, visParams, 'Greenest pixel composite');\n```\n\nThe result of this code should look something like Figure 9. Comparing Figure 9 to the\nmedian composite shown in [Figure 6](/earth-engine/tutorials/tutorial_api_05#compositing-with-reducers),\nobserve that the greenest pixel composite is indeed much greener. However, close\nexamination of water bodies should make a different problem apparent. Specifically,\nwater bodies now appear cloudy. This is due to the way the `qualityMosaic()`\nmethod works: at each location, the entire time series is examined and the pixel with the\nmaximum value in the NDVI band is set as the composite value. Because NDVI is higher over\nclouds than water, water areas get cloudy pixels, while vegetated areas all appear green\nbecause NDVI is highest when the vegetation in the pixel is photosynthetically active.\nFigure 9. Landsat 8 greenest pixel composite.\n\nNow you've seen several ways to composite and mosaic images in Earth Engine. You can make\nrecent-value, median, or greenest-pixel composites from images filtered by time and place\nor all images in the collection. You've learned how to do computations on the imagery and\nextract information. The next page covers ways to get information out of Earth Engine, for\nexample as a chart or a dataset exported to your Google Drive folder. \n[arrow_backPrevious page](/earth-engine/tutorials/tutorial_api_05) [Next pagearrow_forward](/earth-engine/tutorials/tutorial_api_07)"]]