Earth Engine یک ابزار تحلیلی قدرتمند است، اما ممکن است لازم باشد نتایج تجزیه و تحلیل خود را صادر کنید تا نمودارها، تصاویر، نقشهها و غیره را در گزارشها یا نشریات جاسازی کنید. در این قسمت با نحوه ایجاد نمودارها و تصاویر قابل صادرات و مشاهده در نرم افزارهای دیگر آشنا می شوید. به یاد بیاورید که در بخش قبل ، از کدی مانند زیر برای اضافه کردن یک باند NDVI به هر تصویر در یک مجموعه استفاده کردید، جایی که متغیر l8 به مجموعه بازتاب Landsat 8 TOA اشاره می کند:
ویرایشگر کد (جاوا اسکریپت)
// Import the Landsat 8 TOA image collection.
var l8 = ee.ImageCollection('LANDSAT/LC08/C02/T1_TOA');

// Map a function over the Landsat 8 TOA collection to add an NDVI band.
var withNDVI = l8.map(function(image) {
  var ndvi = image.normalizedDifference(['B5', 'B4']).rename('NDVI');
  return image.addBands(ndvi);
});
نمودار
فرض کنید آنچه شما می خواهید در واقع نمودار NDVI در طول زمان در یک مکان مشخص است. برای ایجاد چنین نموداری، اولین قدم انتخاب مکان مورد علاقه است. با گرفتن ابزار ترسیم نقطه، یک نقطه ایجاد کنید ( ) و یک هندسه تک نقطه ای در منطقه مورد علاقه خود ایجاد کنید. (اگر قبلاً واردات دارید، روی Geometry Imports بروید و ابتدا + لایه جدید را کلیک کنید). نقطه را در منطقه ای از کشاورزی، جنگل های برگریز، علفزار سالانه یا برخی از پوشش های زمین دیگر با چرخه سالانه قرار دهید). واردات
 roi نام ببرید. (برای اطلاعات در مورد ایجاد هندسه به صورت برنامه ای به این صفحه مراجعه کنید).
حالا بیایید از نقطه roi برای ایجاد نموداری از NDVI در طول زمان در پیکسل زیر آن نقطه استفاده کنیم. راه ساخت نمودار در Earth Engine با بسته ui.Chart است. ( در مورد ساخت نمودار در Earth Engine بیشتر بیاموزید ). به طور خاص، برای ایجاد نمودار در طول زمان، می توانید از متد ui.Chart.image.series() استفاده کنید:
ویرایشگر کد (جاوا اسکریپت)
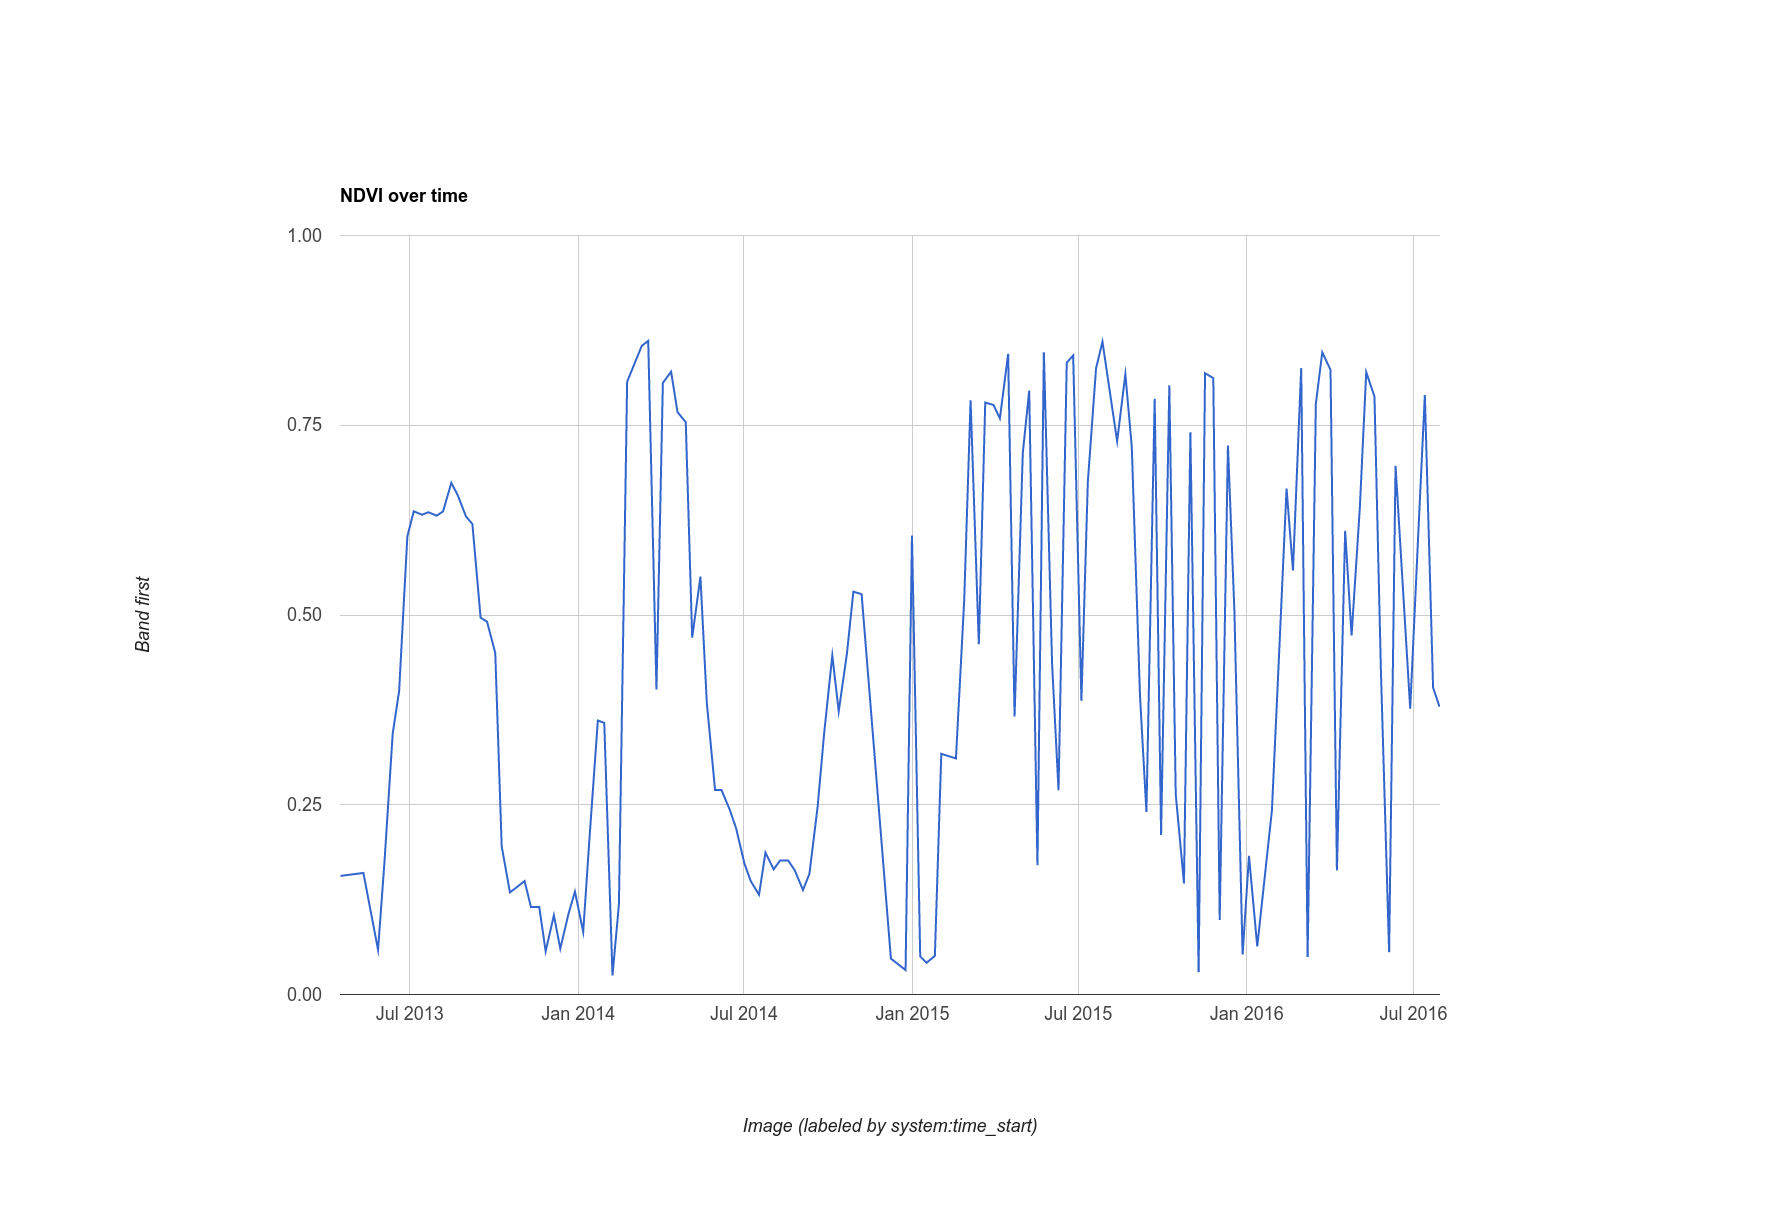
// Create a chart.
var chart = ui.Chart.image.series({
  imageCollection: withNDVI.select('NDVI'),
  region: roi,
  reducer: ee.Reducer.first(),
  scale: 30
}).setOptions({title: 'NDVI over time'});

// Display the chart in the console.
print(chart);
برای هندسه roi ، نقطهای را در یک منطقه کشاورزی انتخاب کردیم که نتیجه آن نموداری است که چیزی شبیه به شکل 10 است. توجه داشته باشید که پارامترهای سازنده نمودار شامل یک کاهنده و مقیاسی مانند reduceRegion() هستند. از آنجایی که نقطه ای که ما به عنوان یک منطقه ارائه می کنیم فقط می تواند یک پیکسل را قطع کند، استفاده از کاهنده «اول» کافی است. اگر منطقه بزرگتری دارید، باید از «میانگین» یا کاهشدهنده دیگری استفاده کنید که نحوه جمعآوری پیکسلها را مشخص میکند. همچنین توجه داشته باشید که برای تجسم نمودار، تنها کاری که باید انجام دهید چاپ آن است.
انحراف: پوشش ساده ابر برای Landsat
چیزی که ممکن است در مورد این نمودار متوجه شده باشید این است که سری زمانی مقادیر NDVI در آن نقطه کمی پر سر و صدا به نظر می رسد. این احتمالاً به دلیل ابرها است. برای بهبود این اثر، Earth Engine شامل یک الگوریتم پوشش ابری برای حسگرهای Landsat با باند حرارتی است: ee.Algorithms.Landsat.simpleCloudScore() . یک تصویر بازتابی Landsat TOA را به عنوان ورودی می گیرد و باندی به نام cloud را اضافه می کند که به ترتیب شاخص ابری بودن پیکسل از صفر تا 100، از حداقل تا ابری ترین است. با تغییر تابعی که روی مجموعه نگاشت کرده اید، می توانید از یک آستانه دلخواه (20) در فهرست ابری استفاده کنید تا نمودار را کمی تمیز کنید:
ویرایشگر کد (جاوا اسکریپت)
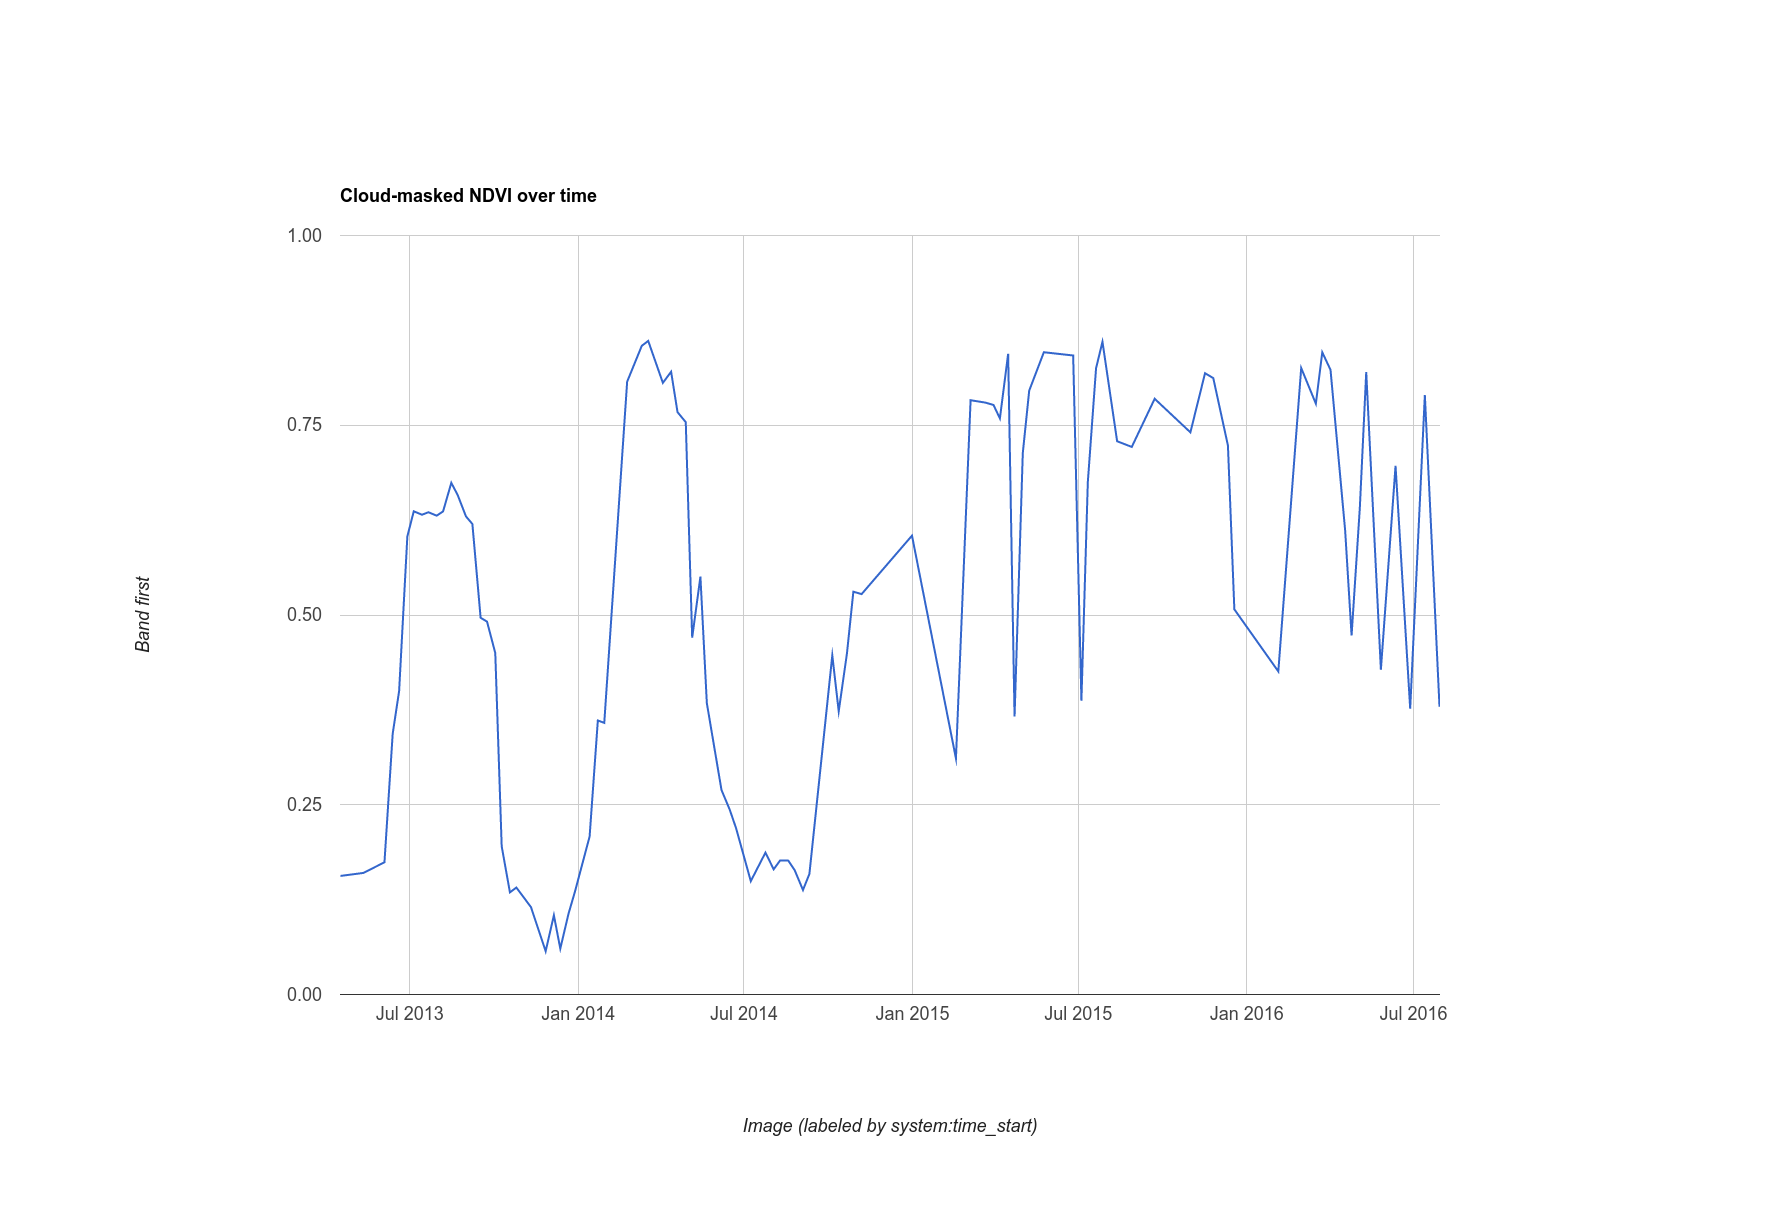
var cloudlessNDVI = l8.map(function(image) {
  // Get a cloud score in [0, 100].
  var cloud = ee.Algorithms.Landsat.simpleCloudScore(image).select('cloud');

  // Create a mask of cloudy pixels from an arbitrary threshold.
  var mask = cloud.lte(20);

  // Compute NDVI.
  var ndvi = image.normalizedDifference(['B5', 'B4']).rename('NDVI');

  // Return the masked image with an NDVI band.
  return image.addBands(ndvi).updateMask(mask);
});

print(ui.Chart.image.series({
  imageCollection: cloudlessNDVI.select('NDVI'),
  region: roi,
  reducer: ee.Reducer.first(),
  scale: 30
}).setOptions({title: 'Cloud-masked NDVI over time'}));
نتیجه پوشش ابری در شکل 11 نشان داده شده است. توجه داشته باشید که سری زمانی کمی صاف تر به نظر می رسد، اما ممکن است همچنان حاوی پیکسل های تحت تاثیر ابرها باشد. آستانه را در نمایه ابری تنظیم کنید و سری های زمانی نمودار شده را مشاهده کنید تا بدانید این آستانه چگونه می تواند بر نتایج شما تأثیر بگذارد.
صادرات تصاویر
شما راهی برای صادرات نمودار داده های محاسبه شده توسط Earth Engine دیده اید، اما در مورد یک تصویر کامل چطور؟ به عنوان مثال، فرض کنید که یک کامپوزیت سبزترین پیکسل را همانطور که در بخش قبل توضیح داده شد ساخته اید:
ویرایشگر کد (جاوا اسکریپت)
var greenest = cloudlessNDVI.qualityMosaic('NDVI');
تنها تفاوت این کد با آنچه قبلا انجام دادید این است که اکنون ما از مجموعه ابری ماسک شده استفاده می کنیم. شما می توانید یک زیر مجموعه (تعریف شده توسط یک منطقه) از آن را با استفاده از بسته Export صادر کنید. ( درباره صادر کردن داده های شطرنجی و برداری از Earth Engine بیشتر بیاموزید .) به عنوان مثال، برای صادر کردن تصویری که می تواند به راحتی در سایر اسناد جاسازی شود، بیایید یک تصویر تجسم ایجاد کنیم، همانطور که قبلاً انجام داده اید ، آن را به پوشه Google Drive خود صادر کنید:
ویرایشگر کد (جاوا اسکریپت)
// Create a 3-band, 8-bit, color-IR composite to export.
var visualization = greenest.visualize({
  bands: ['B5', 'B4', 'B3'],
  max: 0.4
});

// Create a task that you can launch from the Tasks tab.
Export.image.toDrive({
  image: visualization,
  description: 'Greenest_pixel_composite',
  scale: 30
});
وقتی این کد را اجرا می کنید، توجه داشته باشید که یک کار جدید در تب Tasks ایجاد می شود. برای راه اندازی گفتگوی پیکربندی صادرات، روی دکمه RUN در تب Tasks کلیک کنید. هنگامی که وظیفه را پیکربندی کردید، روی دکمه Run در گفتگو کلیک کنید تا صادرات شروع شود. اما قبل از انجام این کار، هشدار دهید:
دلیل اینکه هنگام صادرات بدون آرگومان region باید احتیاط کنید این است که اگر مقدار نسبتاً کوچکی را برای scale تعیین کنید و نقشه به ناحیه بزرگ کوچکنمایی شود، یک تصویر بالقوه بسیار بزرگ را به پوشه Drive خود صادر خواهید کرد. برای جزئیات بیشتر و لیستی از پارامترهای پیکربندی ممکن، به اسناد Export.image.toDrive() در برگه Docs مراجعه کنید.
این مقدمه برای Earth Engine API به پایان می رسد! شما اکنون بسیاری از رایج ترین عملکردهای Earth Engine را دیده اید و باید بتوانید با اطمینان به تحلیل های پیچیده تری بروید. حتماً اسناد را بخوانید و برای پاسخ به سوالات دیگر در انجمن جستجو کنید. کد نویسی مبارک!