将 Search Console 关联至数据洞察
使用集合让一切井井有条
根据您的偏好保存内容并对其进行分类。
2022 年 3 月 8 日,星期二
Google Search Console 可帮助您了解您网站在 Google 搜索中的表现,但要理解您的数据并非易事。如果您设置一个自定义信息中心,其中包含适合您网站的数据可视化功能,这可能有助于您基于数据做出更明智的决策。本博文是重点介绍使用 Google 数据洞察导出、改进和直观呈现 Search Console 数据的一系列博文中的第一篇。
在今天的博文中,我们将探讨如何将 Search Console 数据导入 Google 数据洞察。我们将通过一个示例展示如何将 Search Console 数据下载到 Google 表格中、使用地理区域改进数据以及将电子表格关联到数据洞察。
在未来的博文中,我们将探讨如何创建数据可视化内容,来帮助您监控和分析数据。
准备数据并关联至数据洞察
要将 Search Console 数据导入数据洞察,可采用如下两种方法:
- 如果您希望看到与您在 Search Console 中看到的相同的数据,应使用 Google 数据洞察数据连接器。此方法很简单:访问连接器库,选择 Search Console,然后找到想要关联的资源。您可在数据洞察帮助中心找到有关连接器的指南。
- 如果您想改进 Search Console 提供的数据(例如,将国家/地区按区域归类),您应该先通过网页界面或 API 导出数据。然后,您可以使用 Google 表格或 BigQuery 处理数据,并将其关联至数据洞察。
在本博文中,我们将探讨第二种方法,因为它涉及更多步骤,且能提供更多的自定义机会。您需要完成以下 3 个主要步骤:
- 导出 Search Console 数据。
- 随后在其中添加您自己的数据。
- 将其导入数据洞察。
导出 Search Console 数据
要导出您的数据,请访问 Search Console 效果报告,选择日期范围,点击导出,然后选择 Google 表格。这将创建一个全新的电子表格,我们会在下一步中改进它。您还可以使用 Search Analytics API 获得自动化程度更高的解决方案,但这超出了本博文的探讨范围。
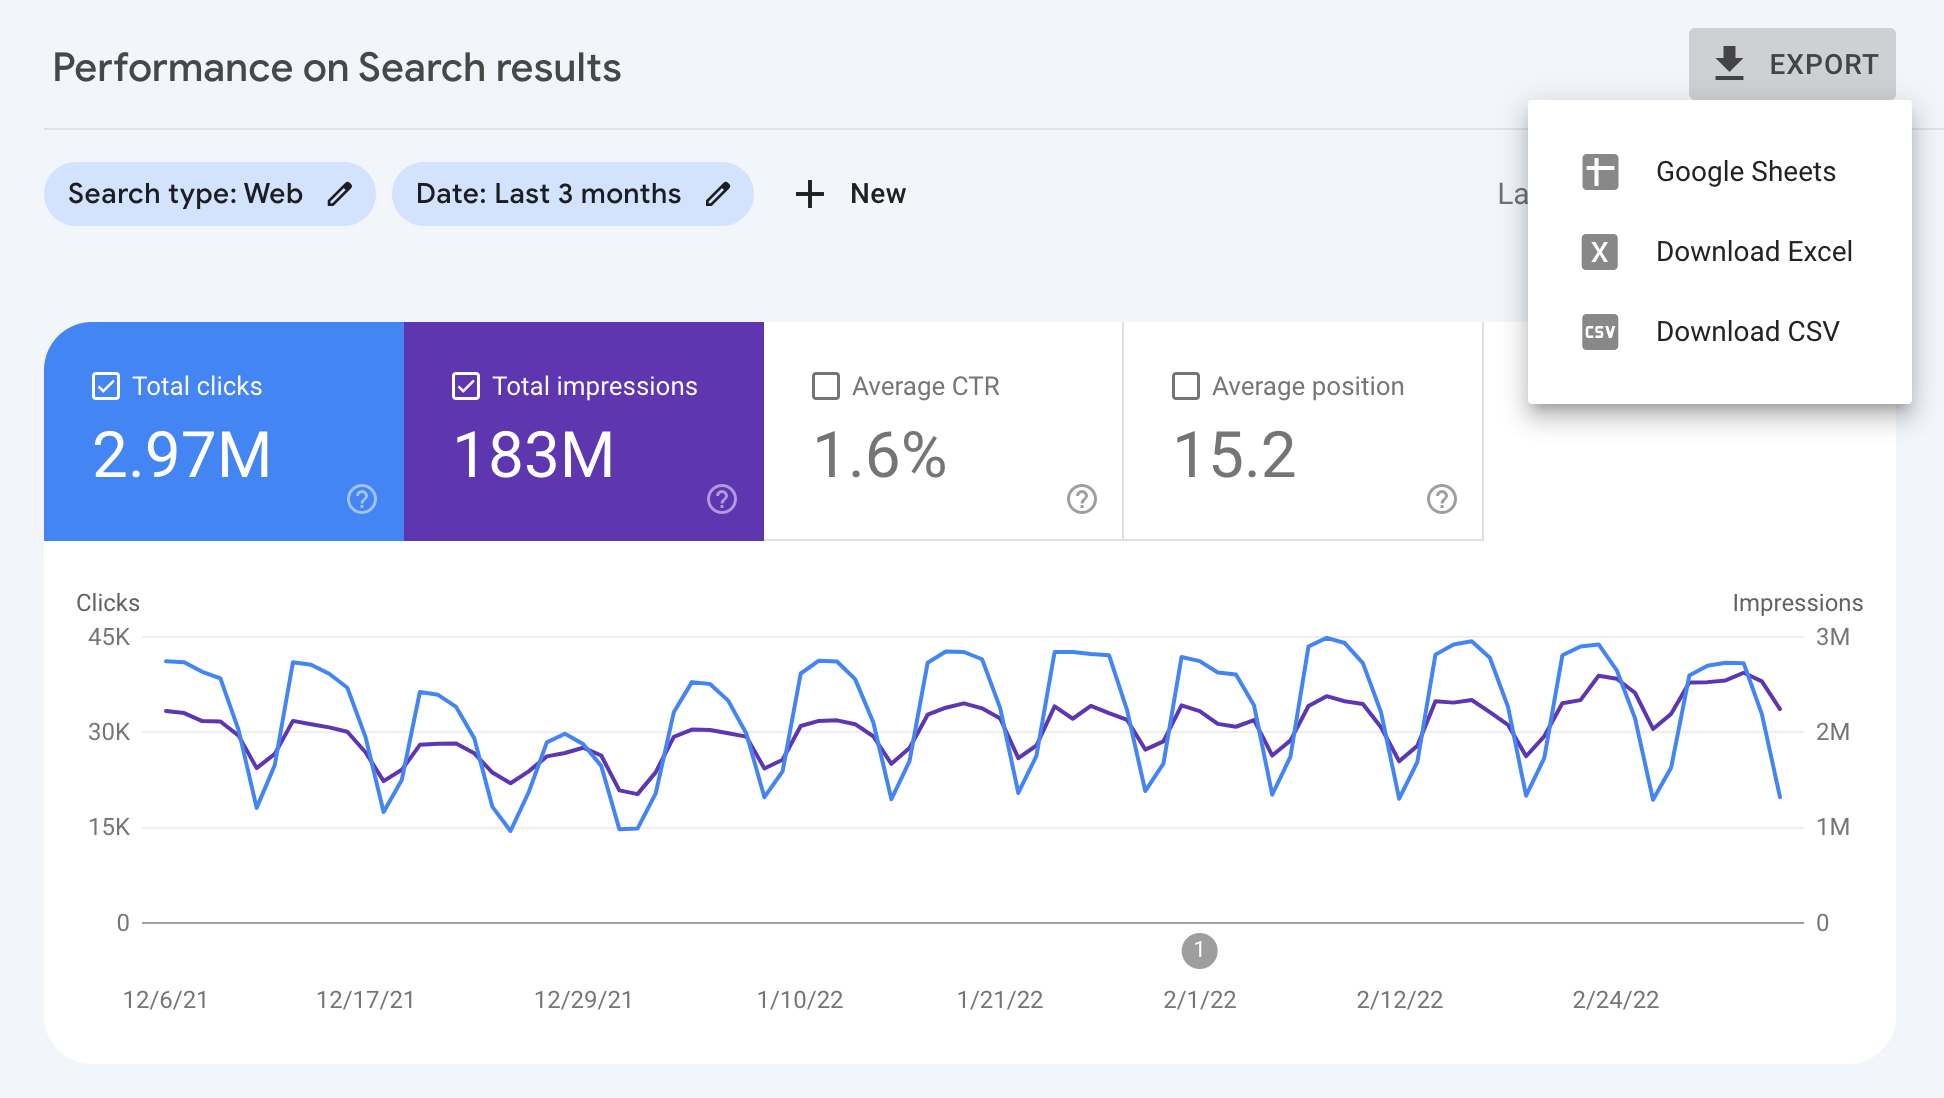
您可以在效果报告帮助文档中详细了解您可以使用的维度和指标。
改进 Search Console 数据
为了演示如何改进您的 Search Console 数据,我们将使用一个简洁的 Google 表格函数 IMPORTDATA,它可以从网址导入数据。在我们的示例中,我们导入的是按区域划分的 ISO 3166 国家/地区表格。
在您从 Search Console 导出的数据中添加一个全新工作表,然后在第一个单元格中输入以下代码:
=IMPORTDATA("https://gist.githubusercontent.com/richjenks/15b75f1960bc3321e295/raw/62749882ed0e9dffa3edd7a9a44a7be59df8402c/countries.md", "|")
在 Search Console 表格中,为区域创建一列,并使用 VLOOKUP
函数将这些区域与国家/地区匹配。
下方是一个示例表格,展示了表格最终的呈现效果。
嵌入式视图:显示按国家/地区区域改进的 Search Console 数据的表格
尽管我们在此示例中改进的是地理位置数据,但您也可以按照相同的流程添加任何类型的信息。例如,如果您有一个查询分类,可使用它将查询分成多个类别。
将 Google 表格关联至数据洞察
最后,将您的 Google 表格关联至数据洞察。为此,请访问连接器库,选择 Google 表格,然后查找您新创建的电子表格;但请务必选择正确的表格。
数据进入数据洞察后,可视化工作就会开始…
下一篇
在本系列的下一篇博文使用数据洞察实现 Google 搜索流量监控(及更多功能!)中,我们将探讨不同类型的信息中心,并提供分步示例供您参考。
与往常一样,如果您遇到任何问题,请通过 Google 搜索中心社区或数据洞察社区告知我们。此外,如果您使用 Twitter,请务必关注我们;我们会在未来推送更多相关博文 - 敬请期待!
发布者:Daniel Waisberg,搜索技术推广工程师
如未另行说明,那么本页面中的内容已根据知识共享署名 4.0 许可获得了许可,并且代码示例已根据 Apache 2.0 许可获得了许可。有关详情,请参阅 Google 开发者网站政策。Java 是 Oracle 和/或其关联公司的注册商标。
[null,null,[],[[["\u003cp\u003eThis post explains how to export, enhance, and visualize Search Console data using Google Data Studio for better website performance analysis.\u003c/p\u003e\n"],["\u003cp\u003eYou can directly connect Search Console to Data Studio or enhance the data by exporting it to Google Sheets for adding custom information like geographical regions.\u003c/p\u003e\n"],["\u003cp\u003eThis post focuses on enhancing Search Console data in Google Sheets by adding geographical regions using IMPORTDATA and VLOOKUP functions and then connecting it to Data Studio.\u003c/p\u003e\n"],["\u003cp\u003eFuture posts will cover creating data visualizations in Data Studio for monitoring and analyzing your website's search traffic data.\u003c/p\u003e\n"],["\u003cp\u003eEngage with the Google Search Central or Data Studio communities for questions and follow Google Search Central on Twitter for future updates.\u003c/p\u003e\n"]]],["This guide details how to enhance and visualize Google Search Console data in Google Data Studio. It outlines two methods for importing data: directly via the Data Studio connector or by first exporting and manipulating the data. The preferred method involves exporting Search Console data to Google Sheets, enriching it (e.g., adding geographical regions using the `IMPORTDATA` and `VLOOKUP` functions), and then connecting the enhanced spreadsheet to Data Studio for custom visualizations. The next steps include monitoring the data using Data studio.\n"],null,["# Connecting Search Console to Data Studio\n\nTuesday, March 08, 2022\n\n\n[Google Search Console](https://goo.gle/searchconsole) gives you insight into your website performance in Google Search,\nbut understanding your data can be a challenge. If you set up a custom dashboard with data visualizations that work for **you** , it might help you\nmake better decisions that are supported by data. This post is the first in a series of posts that will focus on exporting, enhancing, and visualizing\nSearch Console data using [Google Data Studio](https://support.google.com/datastudio/answer/6283323).\n\n\nIn today's post, we'll discuss how to bring your Search Console data into Google Data Studio. We'll show an example where we download Search Console data\ninto Google Sheets, enhance the data with geographical regions, and connect the spreadsheet to Data Studio.\n\n\nIn future posts, we'll discuss how to create data visualizations to help you monitor and analyze your data.\n\nPrepare the data and connect to Data Studio\n-------------------------------------------\n\n\nIn order to import Search Console data into Data Studio, there are two roads you can take:\n\n- If you are happy to see the same data as you see in Search Console, you should use the Google Data Studio data connector. This option is straightforward: visit the [connector gallery](https://datastudio.google.com/data), choose Search Console, and find the property you'd like to connect. You can find a guide to the connector in the [Data Studio Help Center](https://support.google.com/datastudio/answer/7314895).\n- If you'd like to enhance the data provided by Search Console (for example, clustering countries into regions), you should first export the data from the web interface or through the API. Then, you can manipulate the data with Google Sheets or BigQuery and connect it to Data Studio.\n\n\nIn this post we'll discuss the second option, since it requires more steps and offers more customization opportunities. There are three main steps you need to take:\n\n1. Export Search Console data.\n2. Add your own data on top of it.\n3. Import it into Data Studio.\n\n### Export Search Console data\n\n\nIn order to export your data, visit the Search Console [Performance report](https://search.google.com/search-console/performance/search-analytics),\nchoose a date range, click **Export** , and choose Google Sheets. This will create a new spreadsheet, which we'll enhance in the next step. You can also use\nthe [Search Analytics API](/webmaster-tools/v1/searchanalytics/query) for a more automated solution, but that's\nout of scope for this post.\n\n\nYou can read more about the dimensions and metrics that will be available to you in the [Performance\nreport help documentation](https://support.google.com/webmasters/answer/7576553#dimensions).\n\n### Enhance Search Console data\n\n\nTo show how to enhance your Search Console data, we'll use a neat Google Sheets function, [IMPORTDATA](https://support.google.com/docs/answer/3093335),\nwhich can import data from a URL. In our example, we're importing the\n[ISO 3166 countries by region](https://gist.githubusercontent.com/richjenks/15b75f1960bc3321e295/raw/62749882ed0e9dffa3edd7a9a44a7be59df8402c/countries.md) table.\n\n\nAdd a new sheet to the data you exported from Search Console and enter the following code to the first cell: \n\n```text\n=IMPORTDATA(\"https://gist.githubusercontent.com/richjenks/15b75f1960bc3321e295/raw/62749882ed0e9dffa3edd7a9a44a7be59df8402c/countries.md\", \"|\")\n```\n\n\nIn the Search Console sheet, create a column for **Region** and use the [VLOOKUP](https://support.google.com/docs/answer/3093318)\nfunction to match the regions to the countries.\n\n\nHere is a [sample sheet](https://docs.google.com/spreadsheets/d/1WoyovWWCLq9uaYfnsICL4uMQMApaoNhjMf8U4nl0ZHQ/) showing how the final table would look.\n\n\n*Embedded: Table showing Search Console data enhanced with country regions*\n\n\nEven though we're using an example to enhance the geographical data, you can use the same process to add any type of information. For example, if you have a query classification,\nyou could use that to group queries into categories.\n\n### Connect Google Sheets to Data Studio\n\n\nFinally, connect your Google Sheets to Data Studio. To do this, visit the [connector gallery](https://datastudio.google.com/data),\nchoose Google Sheets, and find your newly created spreadsheet; but make sure to choose the right sheet.\n\n\nOnce the data is in Data Studio, the visualization work begins...\n\nNext\n----\n\n\nIn the next post in this series, [Monitoring Search traffic (and more!) with Data Studio](/search/blog/2022/03/monitoring-dashboard), we'll discuss different types of dashboards and provide step-by-step examples for you to follow along.\n\n\nAs always, let us know if you have any questions through the [Google\nSearch Central Community](https://support.google.com/webmasters/threads?thread_filter=(category:search_console)) or the [Data Studio Community](https://support.google.com/datastudio/threads?thread_filter=(category:connect_to_data)).\nAlso, if you're on Twitter, make sure to [follow us](https://twitter.com/googlesearchc); we'll announce future posts over there - *stay tuned!*\n\nPosted by [Daniel Waisberg](https://www.danielwaisberg.com), Search Advocate"]]